




Running multiple projects at once and want them all on one timeline? A multi-project Gantt chart in Ganttify puts every project you pick on the same chart, each as its own group of rows. That portfolio view shows where work overlaps, which weeks are overloaded, and what has to finish in one project before the next one can start.
Create a multi-project Gantt chart
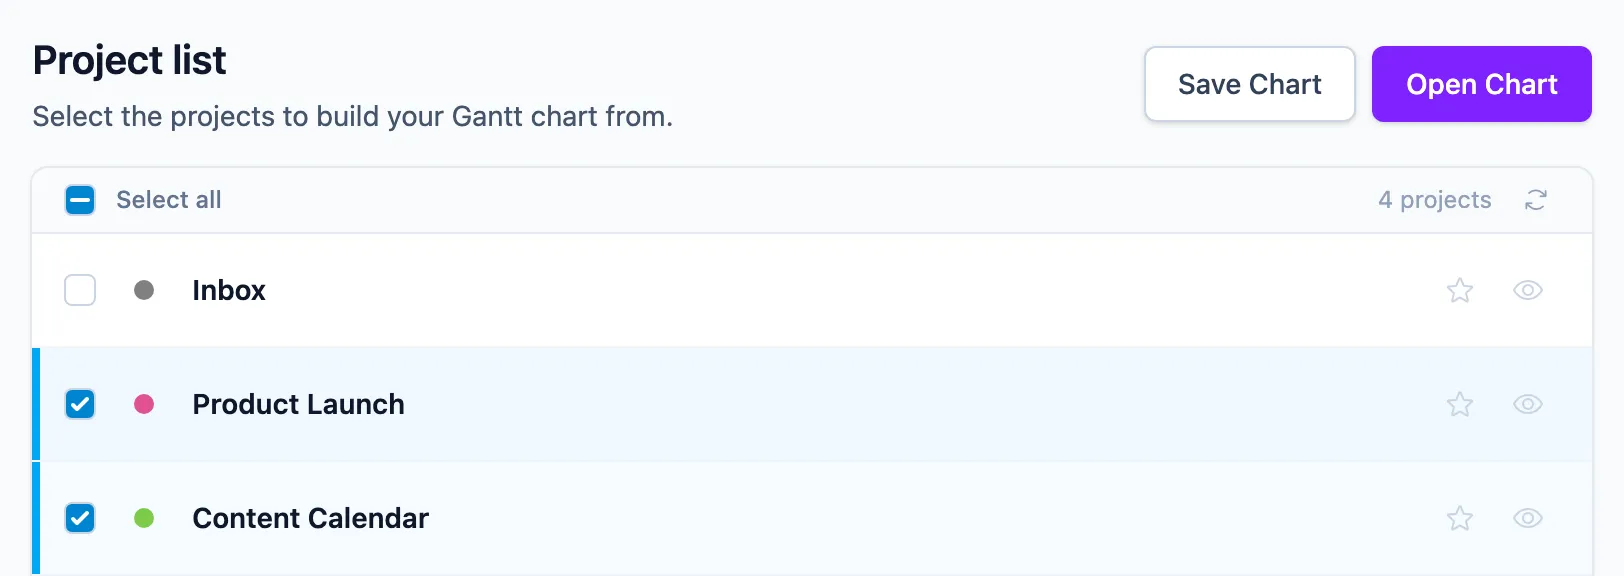
On the Project List, tick every project you want on the chart. Then click Open Chart to open them together, or Save Chart to keep the selection for later. The chart is saved with your charts either way, so you only pick the projects once.
Each project becomes a group of rows, with the project’s name as its header. Inside it sits the structure your integration already has: lists, sections or columns, and the tasks under them. Collapse a group to shrink a project to one line while you focus on another.
Keep a multi-project chart quick and readable
Every time the chart opens, each project on it is read in full from your integration, so the more projects a chart holds, the longer it takes to load. Plan in groups of related projects rather than everything at once: one chart per client, per quarter or per team. A focused chart is also easier to read, because past a handful of projects it stops being an overview and starts being a list. If a chart does come up blank, see projects missing or chart not loading.
Add dependencies across projects
Dependencies aren’t limited to one project. Right-click the time block or due date of the task that comes first, choose add dependency, then click the task in another project’s group that has to wait. When the kickoff in one project slips, the dependent task in the other moves with it, and both dates sync to your integration. Cross-project dependencies are what make a multi-project chart more than a long one. Read more in dependencies in Ganttify.
Filter the chart to one team or month
A chart with several projects is where the filter earns its keep. Filter and search by name, color, icon or date range to see one team’s work across every project, or everything due this month. Hide the rows of a project that is done for now and bring them back when you need them. Hidden rows stay out of the chart’s read-only link and exports too; filters are for your own screen and don’t carry over to the link.
Share the chart with clients and your team
A multi-project chart is shared like any other. Send a read-only link to a client who follows several of your projects: they see all of them on one timeline, without an account. Or share it with your team and plan the overlap together.
Does my plan include multi-project charts?
Yes. Every plan, and the free trial, includes multi-project charts. Only the number of people on your team depends on the plan you choose.